Data in LogTag online can be viewed visually in your Location or Shipment, or from a LogTag Drive file.
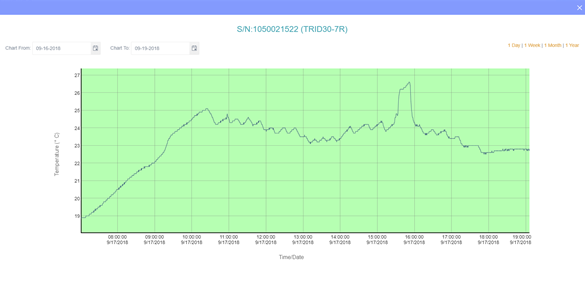
When you click and drag your mouse over a part of the data you are able to zoom in to your data. You are also able to select a data range or show 1 day, 1 week, 1 month or 1 year of data from the current date (Free accounts are limited to showing the last 3 months worth of data in locations).
You can also use the Date Pickers to adjust the readings being displayed.
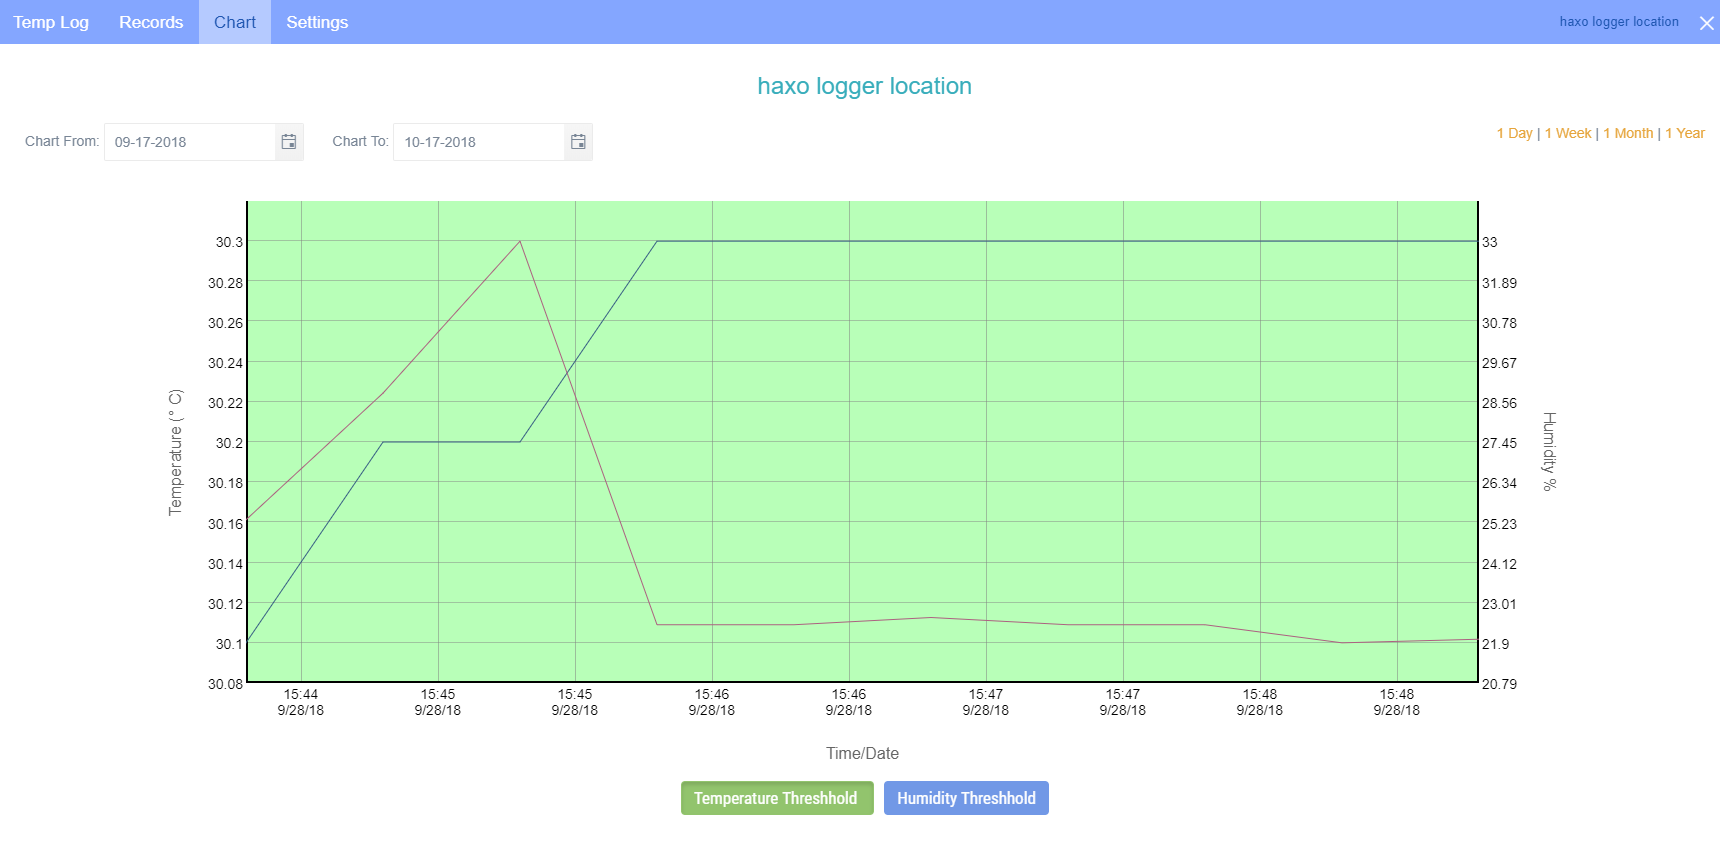
If you’re using a logger with humidity such as a HAXO-8, humidity readings will also be displayed in the chart.
Still stuck? We're a click away
Submit a request